The graphicBook | Effective One Click scalping Tool
Last updated on 02/05/2016
The GraphicBook is created in an endeavor to provide, especially the more active traders and, broadly speaking those who use mobile devices or small monitors, with an even more efficient and operational online Stock Trading tool, better than the classic Flashbook in this regard, and so doing away with the limitations of the current normal vertical book, that may not fit the screen when displaying many price levels or when the stock prices are moving very quickly upwards or downwards.
Below the header, same functionally as that of the Flashbook (into which you can quickly switch just by clicking on the cycle icon , and that's the only unique distinguishing feature of the tile), the tile is divided vertically into just two columns , the first on the left for placing the purchase orders and, the other on the right for the sales orders.
Picture 1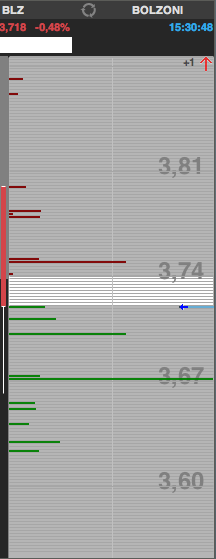 |
The trading amount in each row is represented by colored bars, red for Ask and green for Bid, with the length proportional to their size; rows and bars provide the advantage of being capable to be changed in height by the individual user, and therefore, could be shrunken down a lot any, time as need be, without losing readability : just hold down the right mouse button and simultaneously scroll the MouseWheel, upwards to shrink and down to zoom-in and so expand it. The ' 'spread' 'corresponding price levels will appeare as white empty rows . In the picture beside, we can see the book, set on 10 levels of depth, of a less liquid stock (Bolzoni) shares, where the price levels are far apart and would not be visible within the rows that are either empty or occupied by bars, within the standard height. Another advantageous utility of the graphical visualization is the great ease of comparison between the related securities but with different tick scales in their movements (e.g. Fiat and Ferrari, contracts on the value € / $ on LMAX and CME ). On the price scales, you see on the right column at regular intervals some reference values (in the book of Bolzoni, as shown here in the picture beside, it's at every 7 ticks and for those listed on FCA exchange it's at every 5 ticks). |
Information obtained by simply moving the mouse
By moving the mouse on the various price levels and on the two columns you can seen appear and quickly changesm or disppear, as you hoverover, various information tooltips, and hints, most notably the order information that would be placed with just one click at each cursor position :
- The amount (if in the box) and the requested action ( sell or buy ) will appear below and the price at the top, colored in green for purchases, and red for the sales (picture2, with an example of potential purchase)
- If the quantity in the box is empty, the number of shares still in negotiation at that price level will appear below, else the simple words buy or sell in parentheses if the mouse is on an empty row; the color green or red depends always on the position of the cursor whether on the left column or the right (pictures 3 and 4)
- The selected price level is highlighted within a box outlined in black, under which, if the stock is held in portfolio,the percentage difference will appear in a small white box with respect to the purchase price.
Picture2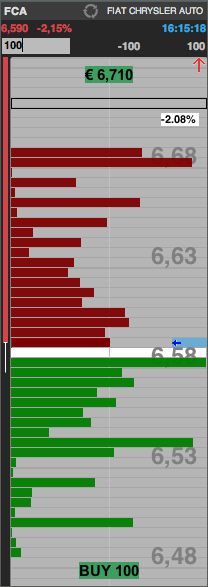 |
Picture 3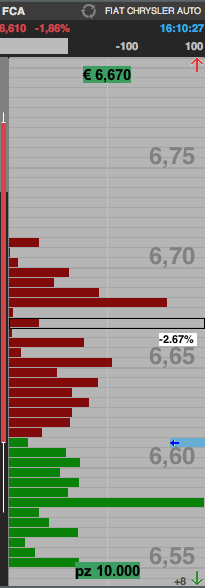 |
Picture 4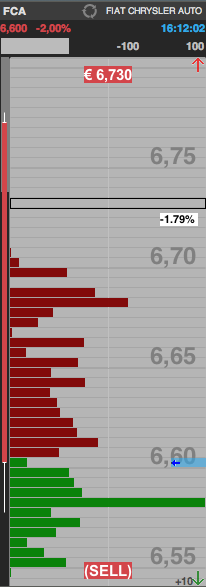 |
'If a quantity is placed in the box , it's also possible to obtain an immediate visual perception of the still virtual order impact on the amount trading at that level: if we add liquidity to the book, in the box with the Black border a softer color bar will be added by the side of the bar already exists (picture 5), or it appears alone in the empty rows; If we remove liquidity from the market, by buying or selling the already existing offers, a new gray colored bar will overlap the existing one''' (picture 6).
If the row is already entirely occupied, it's possible howeve,r to see in the price scale the proportion of the already set amount with respect to the total of the price level, because the image of both the two will give a clear picture, in this case the situation that will be made upon the click, which means when both of them will contribute to the making of the actual bar
| In the picture beside, we can see the remarkable size of the sales order (10,000 pieces in not so wealthy Autogrill order book)) "translated" into proportional dimension graphic bars: in the Ask field (picture 5) we are more than doubling the available amount; in the Bid field (picture 6) we are emptying the whole four levels of the book, and so generating a new ask level with the remaining part of the quantity, all of that resulting in an unfavorable average executed price. Whoever had inadvertently entered one too many zeroes in the box would realize that error easily before the final decisive click for placing the actual order . |
Picture 5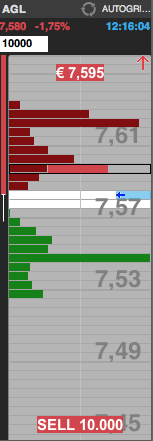 |
Picture 6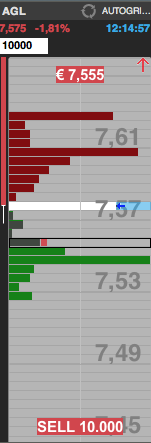 |
Entering and cancelling orders
Picture 7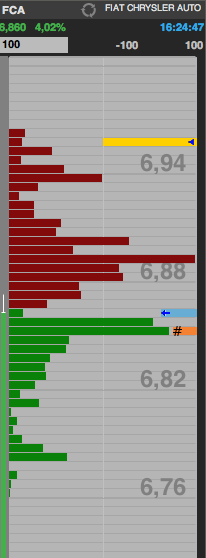 |
The methods of the order entry are similar to those of Flashbook ( quantity in the top left white box , from left to right: the first column for the purchases, the second for placing sales orders), but graphical representation of the operations is different. Please note also that , in the graphicBook '' 'You can not enter yet multiday, or conditional orders. When the ' order is in negotiation on the right, at the purchase price level of the placed order a yellow notch containing a small triangular black will appear . If the horizontal bar representing the amount takes over the row entirely or almost, the yellow notch could disappear or become invisible, but the black arrow will stay visible. For cancelling the order, it's necessary to get with the mouse on the right end of the row, so as to make the cross symbol appear to click on; we can say that the third column is virtual here, but performs the same functionality similar to the visible third column in the normal in Flashbook. If there is only one single order trading, it's easier to click on the top bar besides the amount in negotiation; otherwise, we may remind you that in this way all the trading orders on this security could all be cancelled at once. When the order is executed an orange mark with the pound sign appears at the right end of the row, at the purchase price. |
Further information on prices - on The candle side
Even the information on the most significant prices of the session are provided through a graphical representation.
The small blue arrow contained in a blue notch, seen on the right in all the books illustrated above, indicates 'the last executed price and represents the finishing point of the colored candle' present on the left side of the tile, that starting in the correspondence of the opening price and will therefore be red and on top of the blue notch if the latter was higher, green and below it in the opposite case
The two thin extended shadows of the candle shooting upwards and downwards, of white color, ending respectively in the correspondence of the maximum and minimum prices of the day, and regularly disappearing when the latter coincides with the prices on the ends of the colored candle (therefore, it could be one of them that disappears, as seen in picture1, or both, according to the price movements)
In the upper or lower right corners a little arrow could appear, respectively, red or green, which indicates the presence of significant rpice levels above or below those visible in the book frame. Those levels can be viewed with one or more subsequent clicks on the arrow itself or even by scrolling the book up or down with the mouse wheel.
"Significant levels" means:- Minimum Price
- Maximum Price
- Open price
- closing price
- purchase Price
- Price of an order in negotiation
- book level
The tile menu
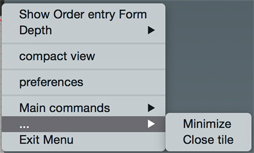
Through the contextual menu of the tile, you can open up the Order Entry Form, choose the number of levels to display, compact the tile, go to the setting page to change the preferences, and, as usual, open the main menu, to reduce the tile into an icon or close it all together.