dBar and Heatmap
Last update Jan 11, 2015
These Tiles belong to the group of the informative tiles, intended solely as reference: you can't used them to enter orders.
dBar

These indices track the performance of the Italian, French, German and American markets, as well as the euro / dollar exchange rates.
The three European indices are drawn from BATS Europe quotes, by using the average between bid and ask.
This figure, though it could differ from that of the main market, it may just shift very slightly, due to the continuous arbitrage activities, by the ever widespread, and more commonly used computerized trading systems. it Should be pointed out that, instead of the weights utilized by the index baskets of the major exchanges, Directa's indices employ a stock by stock basis coefficients determined dynamically by self-adaptive multiple regression techniques.
Compared to the official indices, this involves in some shifts, but, except for some cases, at the beginning or the end of the day, it should normally remain below 0.1%.
dUSA is obtained from the bid / ask average of the Cme futures on the SP index, adjusted every day with interest rate.
by Clicking on the visible index name you can toggle between: the Italian, French, German, US, and the euro / dollar exchange rates; a double click triggers the automatic rotation.
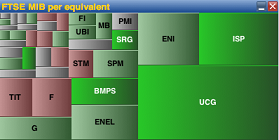
Heatmap
| The tile market map provides an immediate picture of the trade volumes carried out in the day on the single securities through the proportional size of the various boxes (NB: This is a change made some time later, after launching Darwin: initially the size of the rectangles were instead proportional to the capitalization quotes of the securities) |
 |
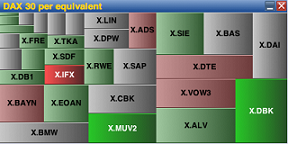 |
Colours red, gray and green indicate respectively downward values (over 1%), stationary (wobbles between -1% + 1%) or uptrend (over + 1%). The colour intensity gives also an instant visual perception about the nature the variations. |
| By hovering over the securites' code: you can read in more detail: |