Reference Charts
Last update June 25, 2014
Darwin allows you to view price charts in two different ways: a convenient Compact Chart, with limited functionalities, and the Java Charts, that allow you to integrate indicators and Technical Analysis tools in your charts.
Please note: Directa provide you also with Visual Trader: a separate fully functional Technical Analysis Softfware (free of charge) that gives you everything you might need to analyze the securities you trade.
Compact Chart
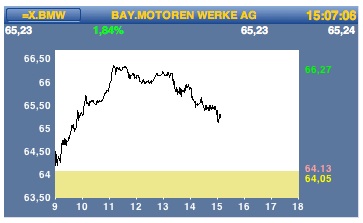 |
The Compact Chart is available in every multiBook Tile, just enter the "=" sign in front of the ticker code in the top left cell, where the multiBook shows the matching securies. |
Java Chart
As the chart was initially intended for consultation purpose only, the Darwin's java chart has been modified to allow also orders placing.
It 'also possible to move the chart within the tile, by right-clicking and holding it then dragging it where desired, in this way you can see the price levels beyond chart's scale (to return to the original position, just press the ESC key on the keyboard).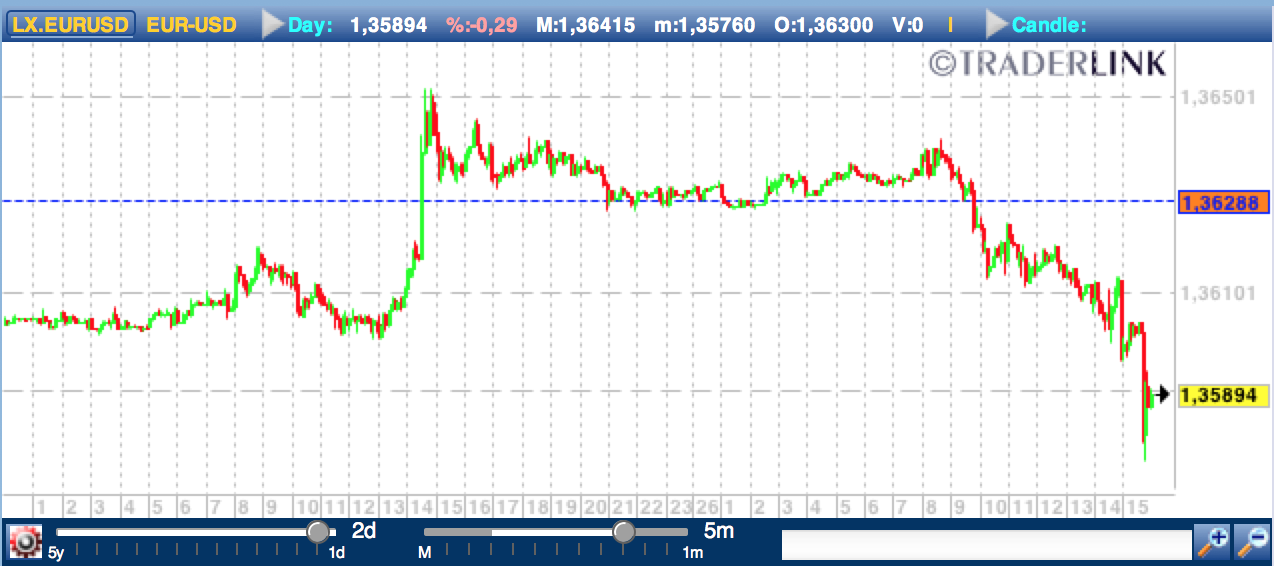
In Darwin the Java chart powered by Traderlink, offers the basic functions of a Technical Analysis software.
The same Java Charts are available under the Main Board of the ''Web" trading platform.
In the lower part of the Tile you will find two sliders which can be used to set the chart History and Time Frame displayed and three keys to adjust the zoom (two for zooming in & out and the third to center the chart) which can also be done simply by using the mouse wheel, other commands are accessible by clicking on the dented wheel icon "settings" in the lower left corner and/or by opening the Tile menu available with a right click. Clicking on the dented wheel expands the lower part and some keys will appear, allowing the following operations (left to right): 1), 2) and 3) trace trend lines useful in technical analysis to draw supports and resistances (dynamic and static, horizontal or vertical respectively) 4) access the Fibonacci Tool, a technical analysis indicator based on the numerical series of the mathematician it is named after (that will help to forecast the price trend targets, identifying significant resistance and support) 5) delete all the studies you added to the chart at once, such as trend lines and indicators (key with basket icon) 6) highlight the pivot points (market support and resistance levels) 7) insert indicators and oscillators, from those available (e.g. moving average, RSI, stochastic, etc.) 8) show the data corresponding to each bar or candlestick (Open, High, Low, Close) 9) select the cursor type (with every click of the mouse you can choose to display alternatively: a vertical and/or horizontal line or just the mouse cursor) 10) select a chart template from the appropriate menu, and change the default model. Please note: it is also possible to save other customized chart templates. 11) view or hide the graphical view of the order book levels after the last price. 12) show or hide the graphical image of the book placing or removing a check mark in the box. |
|
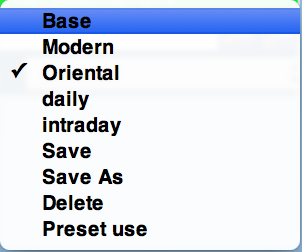
| 13) select from the drop down menu a chart's type among the three available (basic, modern or oriental), edit the one set as pre-defined (default is the base model); you can also save with a name others custom chart models. |
 |
Tile Menu
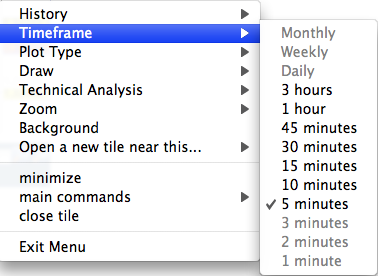 |
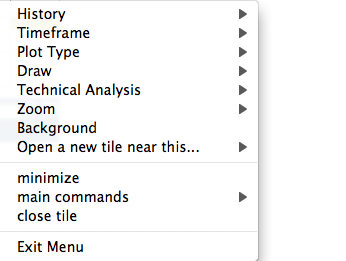
From the main Tile Menu, available right-clicking in an empty space on the chart, it is possible to choose the chart history (up to three years) and the timeframe (that vary according to the chart history), the chart type (candlesticks, bar or line), the zoom level and the background color; with the option technical analysis you can open a submenu where you can choose the trendline type and you can also activate the Fibonacci Tool. |
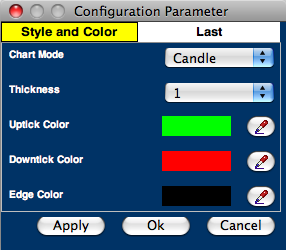
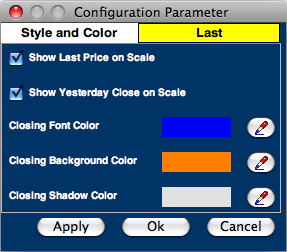
| Other customization are available under Properties from the context menu that you can open by clicking: on price (candlestick, line or bar chart), 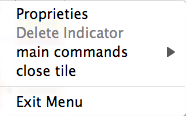 |
 |
on the time scale in the lower part of the chart,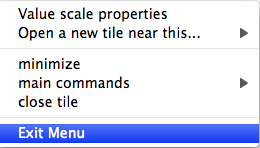 the price scale on the right-hand side of the chart. 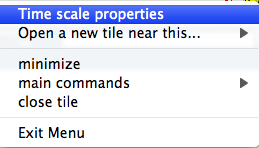 |
 |
| The lower part of the chart refers to the Security Volume and it can be hidden or shown. By right clicking on it, it's possible to choose the plot type, either a histogram or a line. |
 |
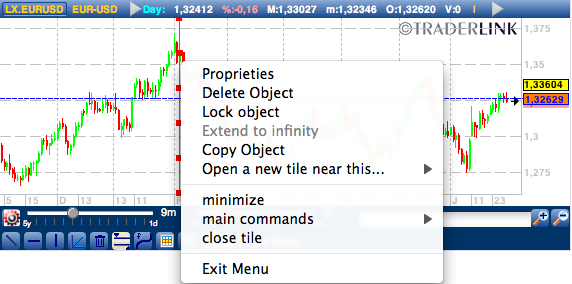
It's also possible to modify a single element: a right clicking on it simultaneously selects it and opens the context menu: e.g. you can erase a single trendline' or an indicator, maintaining all the other elements of your study, through the option eliminate object it's even possible to modify its appearance by choosing properties.