Time&Sales
Last update June 28, 2013
The Time and Sales shows each individual trade as it occurs, and is usually as a scrolling list.
Every time a new trade has place, the time&sales shows the price and quantity traded changing color red, yellow or green depending whether it is respectively below, equal to or above the previous price traded.
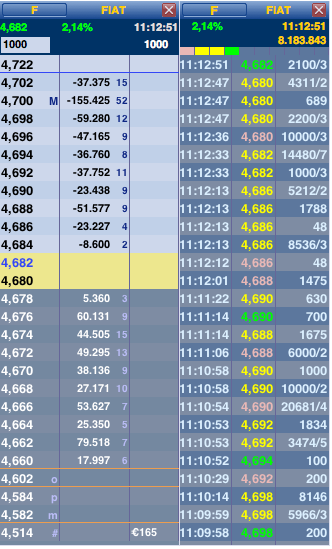
The percentage change of the Security, the time of each trade and the number of shares traded appear on top. A right click on the quantity alternate the figure with the daily number of trades.
The following options can be selected under Preferences in the Tile Menu, or under Main menu>Utilities>Preferences and selecting the appropriate icon:
- ascending or continuous Time and Sales;
- display of a colored bar in which a every price corresponds to a color with the same criterion as the prices;
- addition of a column on the left to display the trade time or just the seconds.
The Tile width of the window can be reduced choosing Compact in the Tile Menu. This command extends to all the books and the Time&Sales grouped in a single Tile.